
One Page Weekly Status Report for PMs: Automate and Done in 30 Minutes

A weekly status report is a short, recurring update that tells stakeholders whether a project is on track, what got done, and what needs their attention right now. The fastest way to write one is to open with a copy-paste line like “Amber: Backend API delayed by vendor outage, timeline still holds if resolved by Friday. Need sign-off on revised scope by Thursday.” That single sentence, sent to sponsors, steering committees, and the project team, does more governance work than a 10-slide deck.
TL;DR:
- Using simple metrics like schedule variance, budget variance, and high-severity risks can predict project issues better than activity counts like ticket closures.
- Sending reports on a consistent day, such as Friday afternoon or Monday morning, helps establish trust but should focus on honest risk and status updates, not just data collection.
- Automating data extraction from meetings and project tools reduces manual effort and speeds up report creation, leaving more time for judgment and decision-making.
- Keeping the report to one page for executives, with detailed data in appendices or linked documents, improves readership and avoids overwhelming stakeholders.
- Starting with a brief executive summary and gradually adding detailed sections is more effective for building reporting discipline than attempting a full template immediately.
Table of Contents
- How to Structure a Weekly Project Status Report
- How to Write a Status Report in 5 Steps
- Which Metrics Actually Belong in the Report?
- When Should You Send the Report and to Whom?
- Common Mistakes That Undermine a Status Report
- Where Automation Actually Helps
- Why Reporting Discipline Beats Reporting Frequency
- Automate the Busywork, Keep the Judgment
- Templates and Guides Worth Bookmarking
- Sources
- FAQ
How to Structure a Weekly Project Status Report
A well-structured weekly status report keeps stakeholders informed without a meeting and forces the team to assess its own progress honestly. That second part matters more than most PMs admit. Writing “we’re on track” is easy. Writing the reason you’re on track, in one sentence, is where the honesty happens.
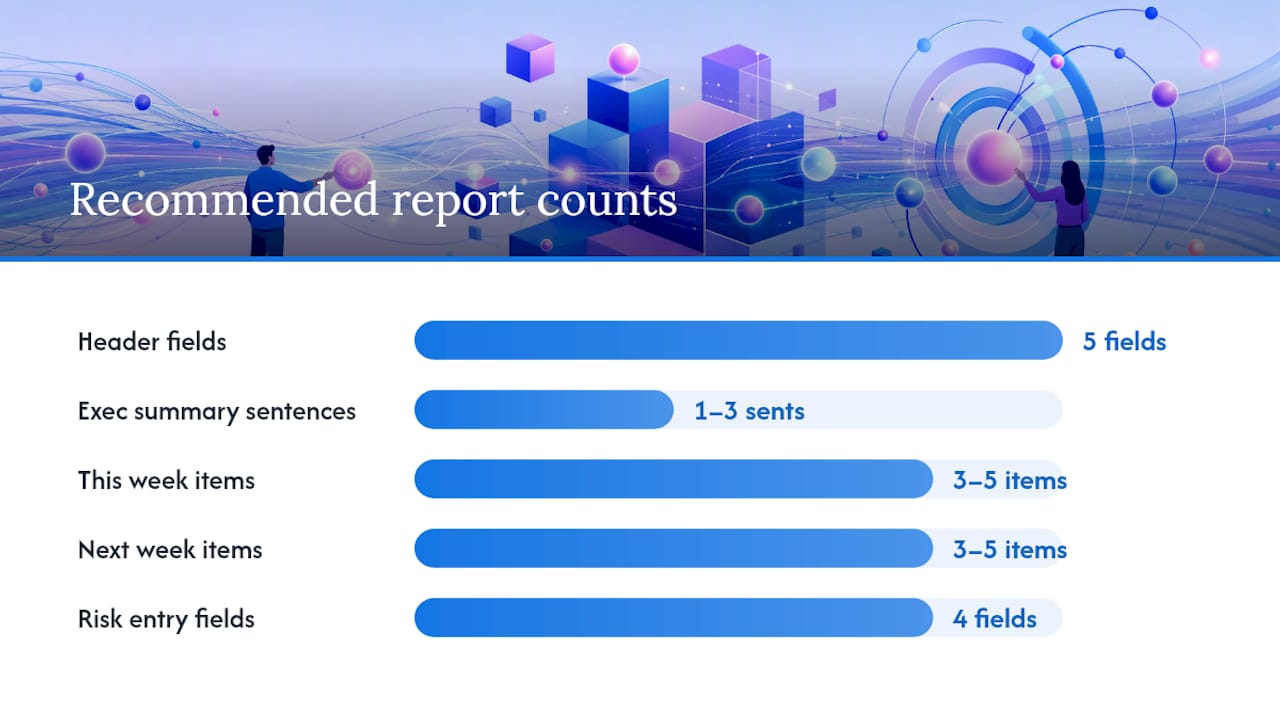
Start with five header fields: project name, reporting period, project manager, overall status (Green, Amber, or Red), and the report date. Keep the executive summary to one to three sentences answering where things stand, whether the project is on track, and what needs attention. That summary should read cleanly in under 150 words, because the people reading it are scanning, not studying.
Below the summary, three sections carry the weight:
- This week: three to five completed deliverables written as outcomes (“API integration tested and deployed”), not tasks (“worked on API”).
- Next week: three to five specific commitments, each with an owner and a date.
- Risks and issues: each entry needs an owner, the impact, the mitigation plan, and a target resolution date.
Separating what’s done, what’s happening now, and what’s coming next isn’t a stylistic choice. Templates that work split Past, Present, and Future explicitly, with concrete deliverables instead of activity logs.
Metrics belong in a small table right after the risks section, not buried in prose:
That table alone tells a sponsor more in five seconds than a paragraph would in five minutes.
How to Write a Status Report in 5 Steps
Producing a clean report doesn’t require a free afternoon. It requires a fixed order of operations.
- Pull the data first. Grab schedule and budget figures from your PM tool, ticket counts from Jira or Asana, and any blockers flagged in stand-ups before you write a single sentence.
- Draft the executive summary before anything else. Write the RAG line and the one clause explaining it. Everything below just supports this line.
- Fill in accomplishments and commitments from owners directly, not from memory. Ask each lead for their one or two completed items and their next commitment.
- Log every risk and issue with a named owner and a mitigation step. A risk without an owner is a risk nobody will fix.
- Cut it down, attach appendices for detail, and send it on the same day and time every week.
Pro Tip: If a week gets chaotic, use the Done, Doing, Blocked method instead of the full template. It’s a faster three-column format that still captures what matters when you have ten minutes, not thirty.
The whole workflow, done in this order, takes most project managers under 30 minutes once the habit sticks.
Which Metrics Actually Belong in the Report?
Three metrics cover most projects: schedule variance, budget variance, and open risk count by severity. Anything beyond those three should earn its place by predicting a problem, not just describing activity.
| Format | Best for | Weakness |
|---|---|---|
| Small table | Comparing this week vs. last week vs. target | Needs consistent data pulls |
| RAG badge | Instant status at a glance | No trend context alone |
| Mini trend line | Showing direction over 3 to 4 weeks | Overkill for short projects |
Story points completed and tickets closed are common metrics that tell you almost nothing about risk. They’re vanity numbers. Schedule variance and open high risks are predictive. If a metric doesn’t change what someone does next, cut it.
When Should You Send the Report and to Whom?
Send it on a fixed day. Friday afternoon works well for wrapping the week; Monday morning works if your stakeholders prefer to start the week informed. Consistency in cadence is what turns a status report into a trusted governance habit instead of an ignored email.
- Executives and sponsors get the one-line summary and RAG status, full stop.
- The project team gets the detailed version with individual commitments and risk owners.
- Email the summary with a link to the live document rather than attaching a static PDF, so updates don’t create version confusion.
- Automate the metrics pull from your PM tool where possible, and reserve your own time for the judgment calls.
Common Mistakes That Undermine a Status Report
Most bad reports fail for the same handful of reasons.
- Running past one to two pages, which guarantees nobody reads the second page.
- Burying the RAG status instead of leading with it, so executives have to hunt for the verdict.
- Listing a risk without an owner or a mitigation date, which makes it decorative rather than actionable.
- Reporting activity (“worked on testing”) instead of outcomes (“testing complete, two defects found”).
- Filling the metrics section with counts that look busy but predict nothing.
Pro Tip: Time yourself reading your own executive summary. If it takes longer than two minutes, it’s too long for the audience that matters most.
A typical status report fits on one page for executives, with detail logs pushed to appendices or linked documents.
Where Automation Actually Helps
To pull metrics by hand from three different tools, then chasing five team leads for their updates, is where most of the 30 minutes disappears. Automation can absorb that part of the job.
- Extracting completed deliverables and decisions directly from meeting recordings instead of manual note taking.
- Flagging contradictions between what one stakeholder said last week and what another said this week, before they turn into a scope dispute.
- Surfacing unanswered questions from a meeting that would otherwise get lost between calls.
- Segua.ai generates meeting minutes in about 30 seconds and builds out project documentation like Gantt charts and requirement registers from the same uploaded content, so the raw material for a status report is ready before you open a blank document.
Judgment calls stay human. Whether a risk is Amber or Red, what mitigation actually makes sense, and which decision needs escalation are calls a tool shouldn’t make for you.
Why Reporting Discipline Beats Reporting Frequency
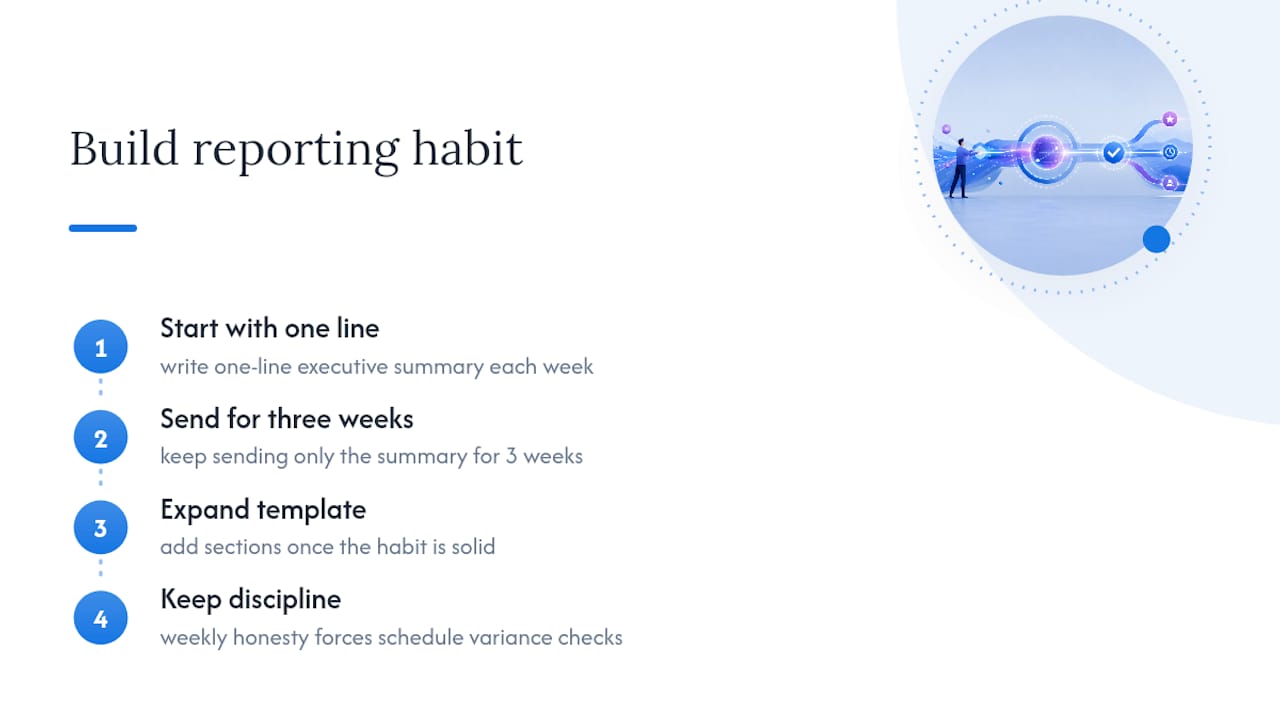
Teams that report weekly with real discipline catch risks earlier than teams that report the same information less consistently. The value isn’t in the cadence itself. It’s in the habit of writing an honest one-line verdict every week, which forces someone to actually look at the schedule variance instead of assuming things are fine.
If you’re building this habit from scratch, don’t start with the full template. Start with the one-line executive summary, send it for three weeks, and add sections only once that habit is solid. Most reporting programs fail not because the template was wrong, but because nobody kept the habit past week two.
Automate the Busywork, Keep the Judgment
Segua is the alternative to spending your Friday afternoon copying numbers between spreadsheets and Slack threads. It pulls meeting minutes, decisions, and open questions directly from your recorded meetings or uploaded documents, and builds the Gantt charts, requirement registers, and status report drafts around them automatically.
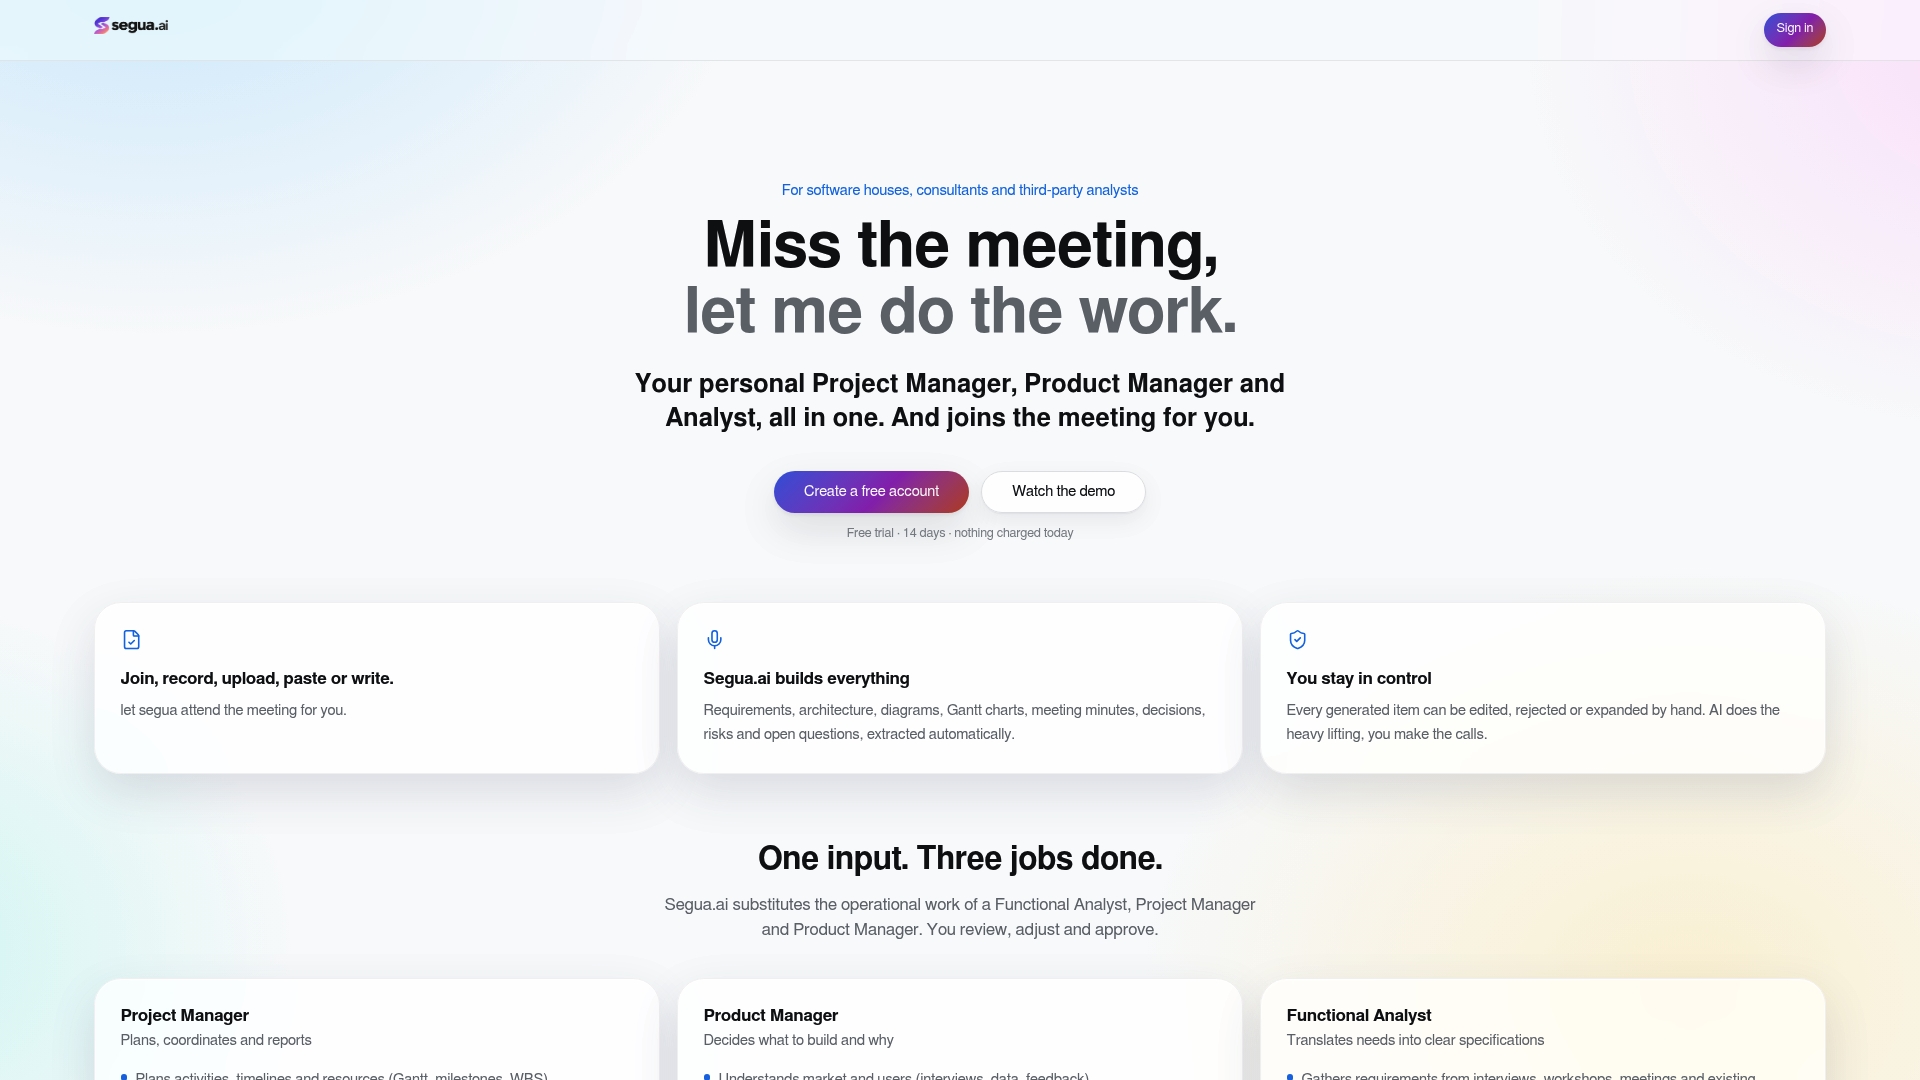
That’s the difference for a busy project manager: the data collection and first draft happen in the background, and you spend your 30 minutes reviewing and deciding, not transcribing. It’s built for PMs, product managers, and analysts who publish a weekly report and would rather not rebuild it from scratch every Friday. See how teams use it for meetings and requirements work, or check how it stacks up against AI notetakers and generic project tools. Pro plans run $39 per month, with a free trial available now if you want to see the 30-second meeting minutes for yourself before committing.
Templates and Guides Worth Bookmarking
For a deeper look at report structure, the At-a-Glance Weekly Project Status Report framework is a solid one-page governance model. Indeed’s weekly report guide offers additional filled examples worth comparing against your own drafts.
Sources
- Weekly Status Report Template: Project Management Formula
- At-a-Glance Weekly Project Status Report
- What Is a Weekly Report? (With Template and Example)
- Weekly Project Status Report: How to Write One
FAQ
What Should a Weekly Status Report Include?
At minimum, it needs an overall status (RAG), an executive summary, completed deliverables, next week’s commitments, and risks with owners and mitigation plans. Most complete templates also include budget and schedule health and a decisions-needed section, kept to one page for executives.
What Does a Good Weekly Status Report Example Look Like?
A strong example leads with “Green: On track, no blockers” or “Amber: Vendor delay pushing delivery by 3 days, mitigation in progress,” followed by three bullet points of completed work and three bullet points of next steps. Risks appear underneath with a named owner and a resolution date for each.
How Is a Status Report Different From a Progress Report?
A status report covers overall health, budget, risks, and decisions needed, while a progress report focuses narrowly on completed milestones. Most weekly governance reporting uses the status report format because it captures problems, not just activity.
How Do I Prepare a Status Report Quickly Each Week?
Pull your metrics first, draft the one-line executive summary before any other section, then fill in accomplishments and next steps from each team lead directly. Tools like Segua.ai can extract meeting minutes and flag open questions automatically, which cuts most of the manual data gathering out of the process.
How Much Does Segua Cost for Automating Reports?
The Pro plan runs 39 EUR per month, extra meeting hours are billed separately, and a free trial is available to test the workflow. Enterprise pricing is available on request through Segua’s pricing page.